How to Turn Infographics into Nudenotes
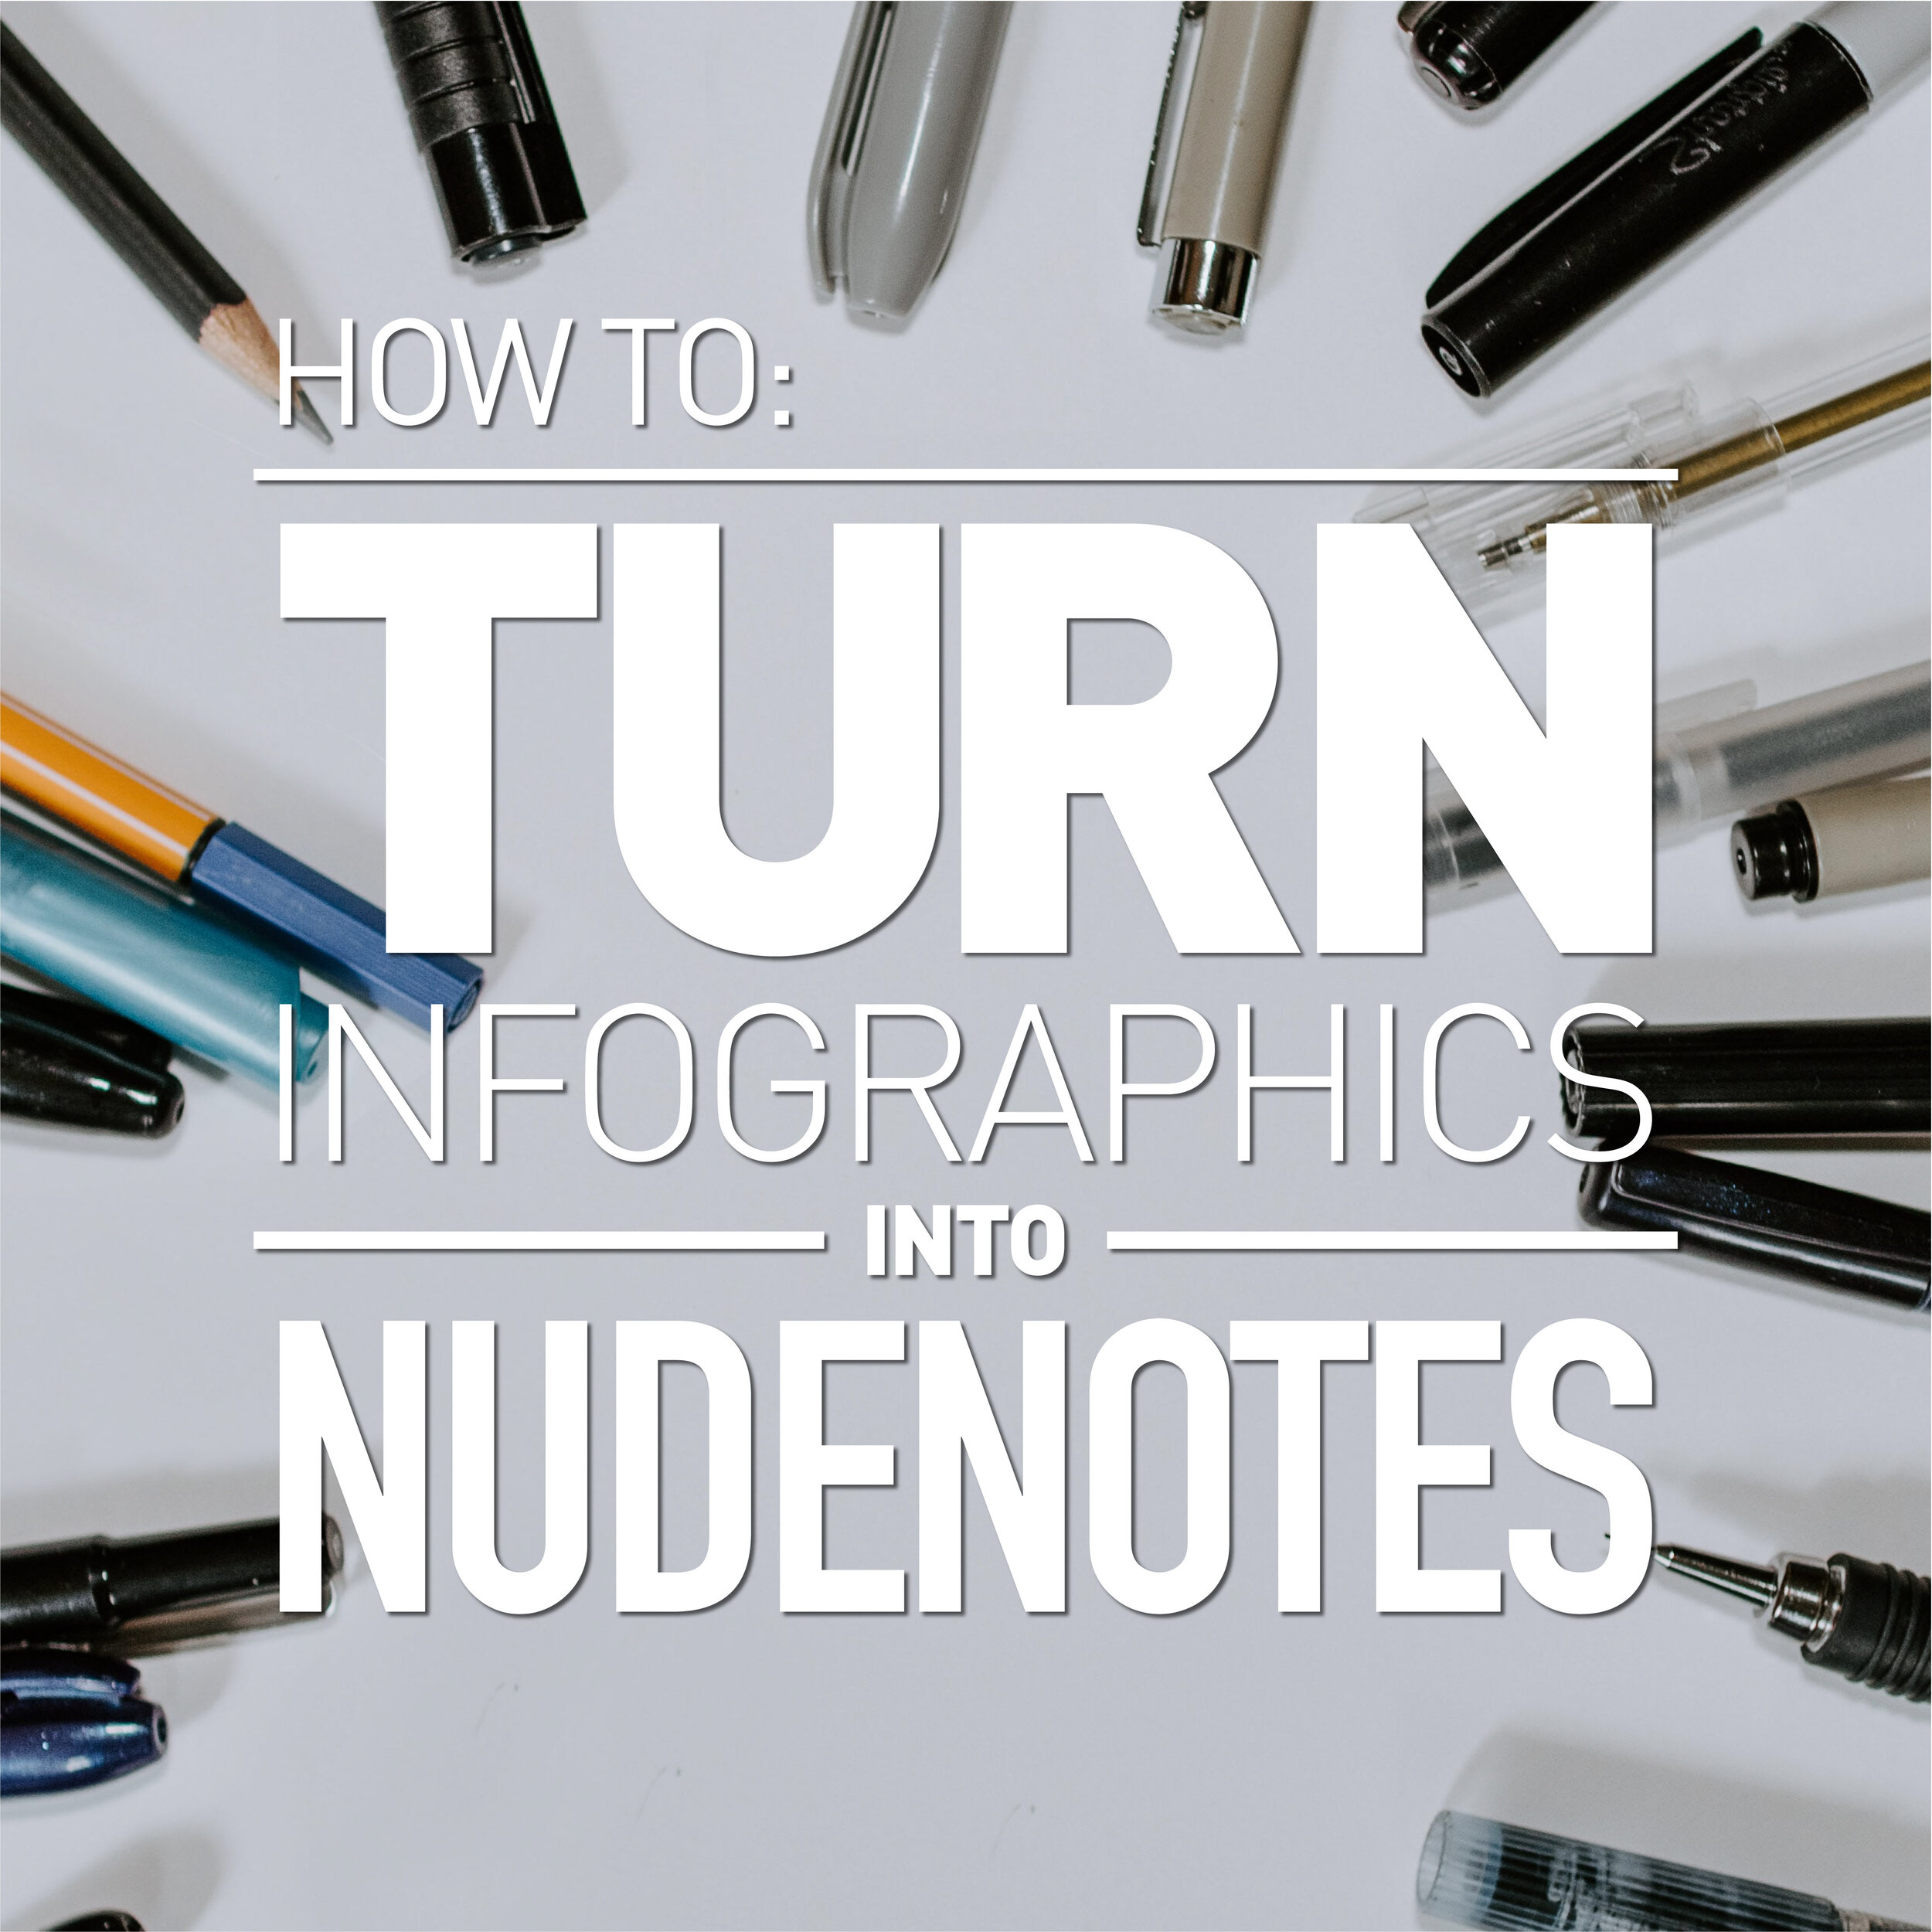
Image courtesy of @kellysikkema via Unsplash.
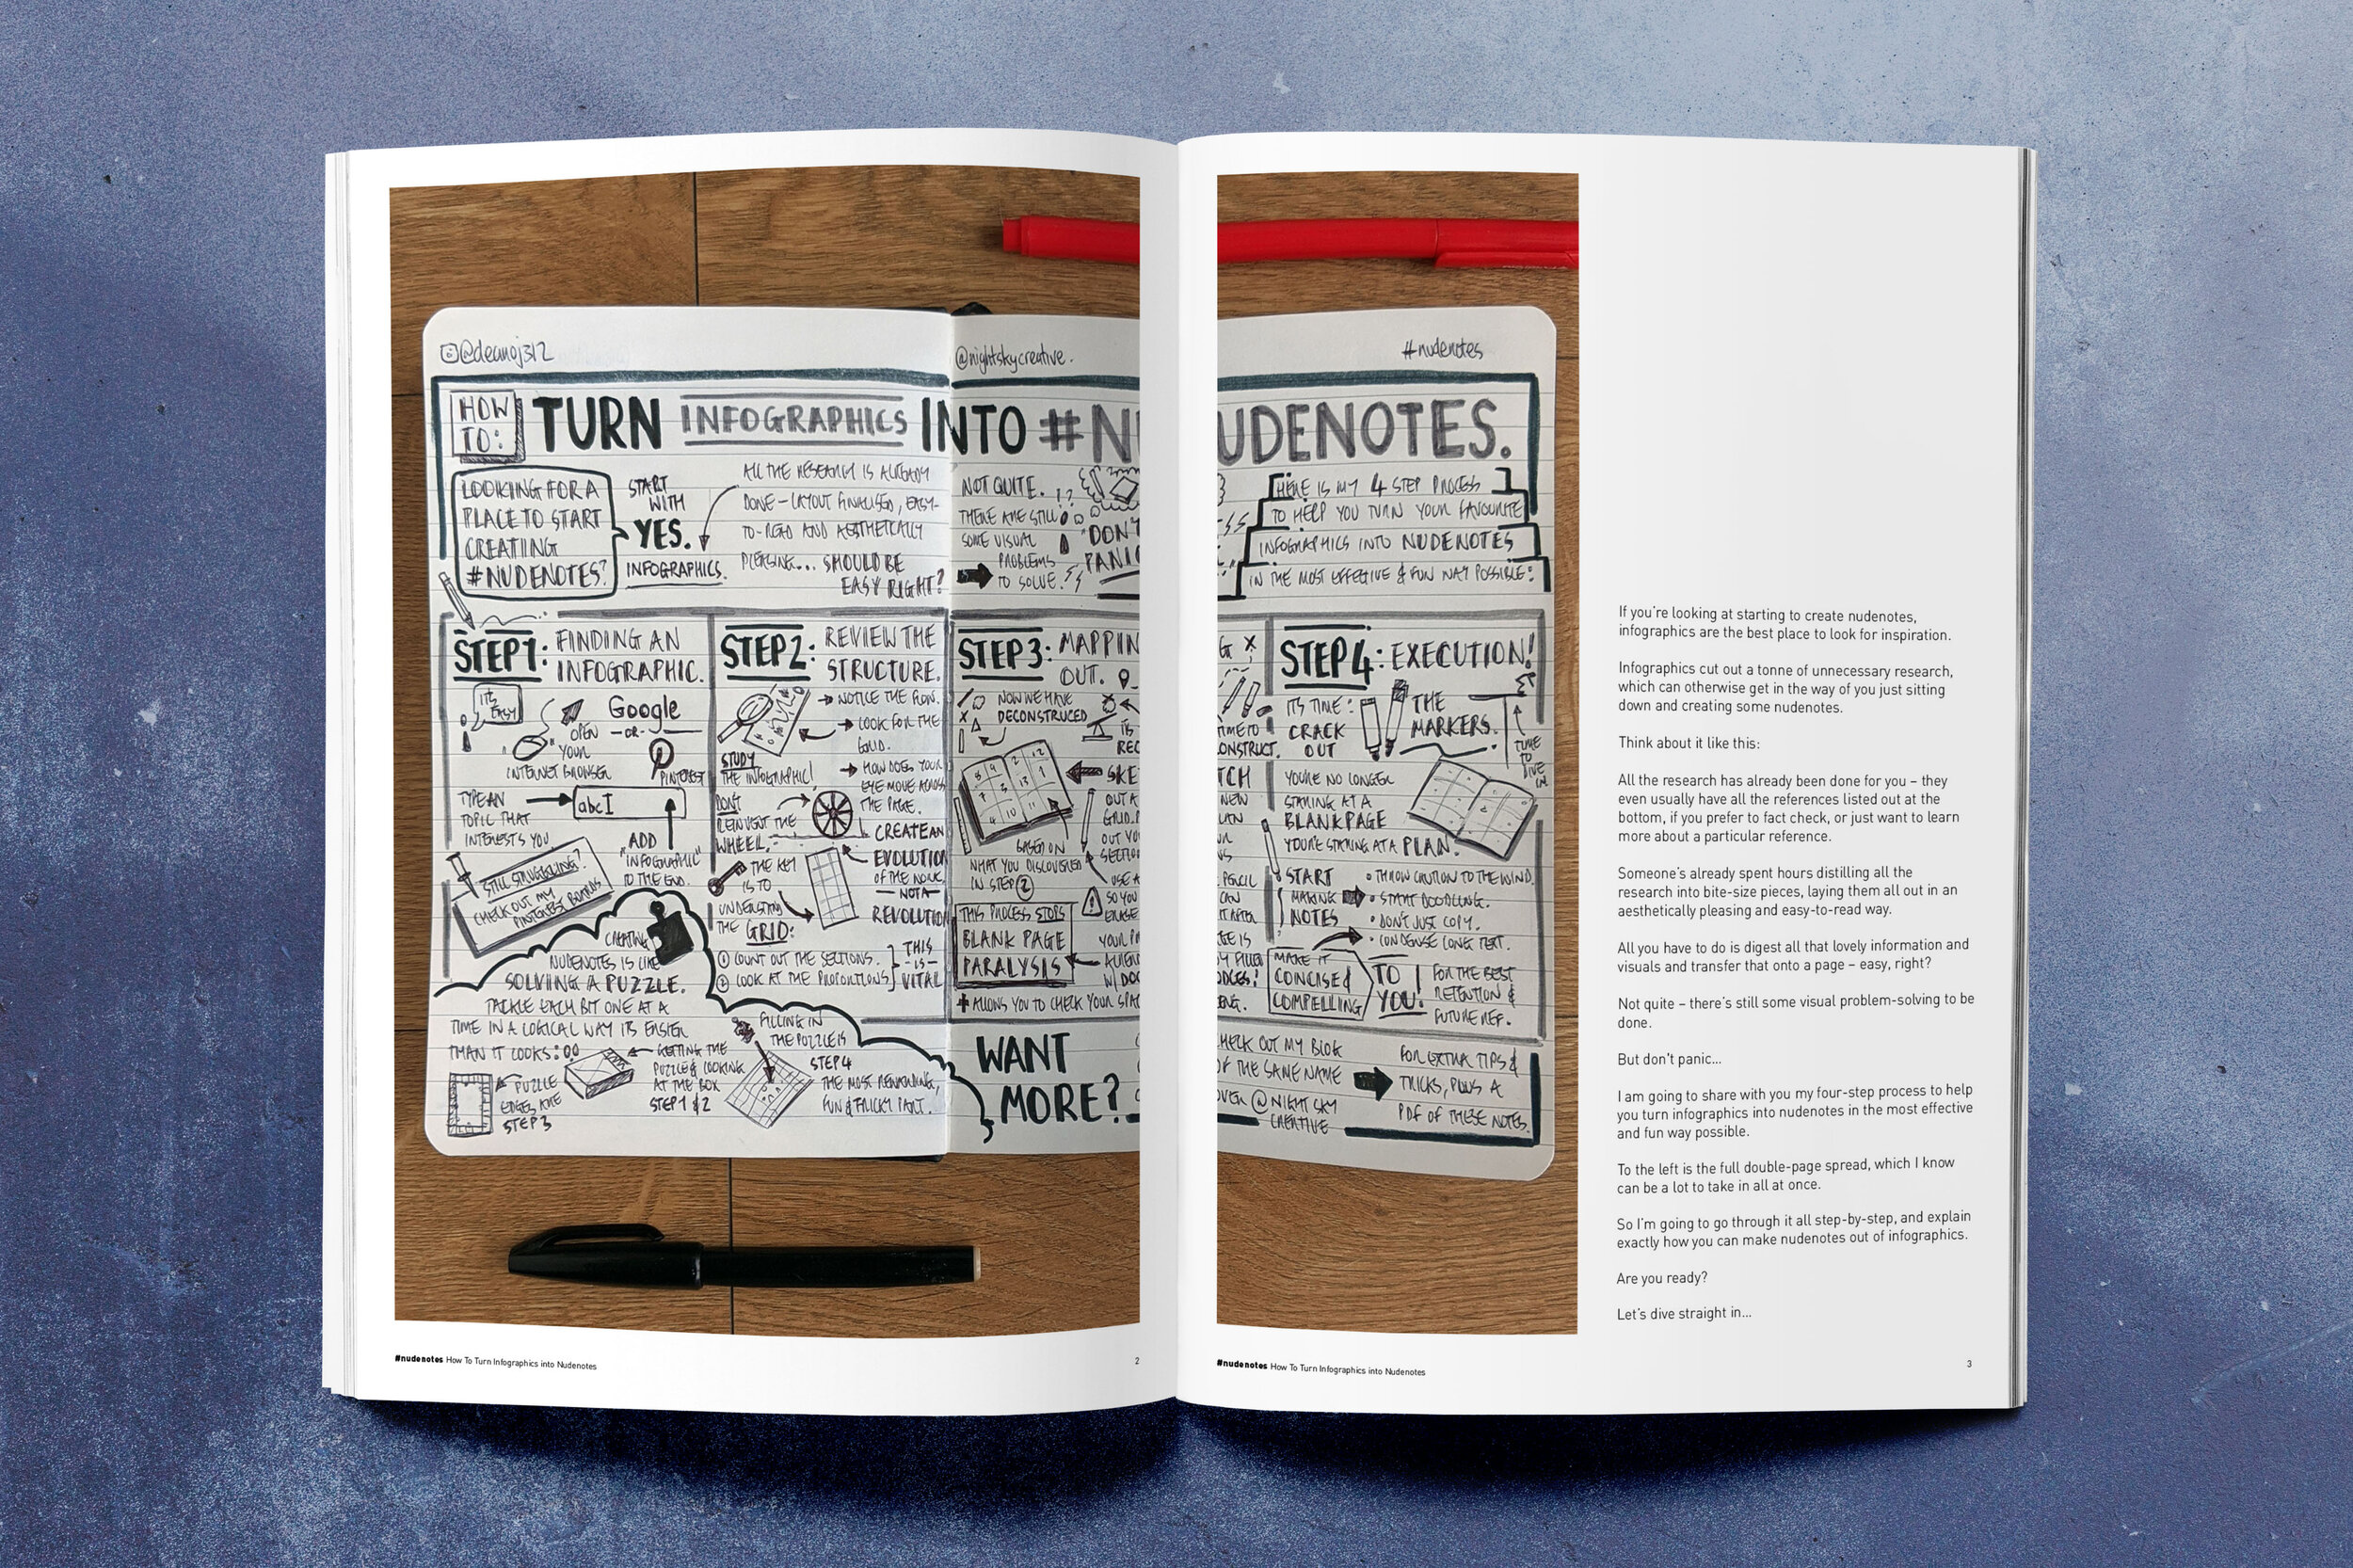
In a recent podcast interview with visual thinking guru Yuri Malishenko (you can listen to the full podcast here), I mentioned that if you’re looking at starting to create nudenotes, infographics are the best place to look for inspiration.
Infographics cut out a tonne of unnecessary research, which can otherwise get in the way of you just sitting down and creating some nudenotes.
Think about it like this:
All the research has already been done for you – they even usually have all the references listed out at the bottom, if you prefer to fact check, or just want to learn more about a particular reference.
Someone’s already spent hours distilling all the research into bite-size pieces, laying them all out in an aesthetically pleasing and easy-to-read way.
All you have to do is digest all that lovely information and visuals and transfer that onto a page – easy, right?
Not quite – there’s still some visual problem-solving to be done.
But don't panic…
Here’s my four-step process to help you turn infographics into nudenotes in the most effective and fun way possible:

That’s the full double-page spread above, which I know can be a lot to take in all at once.
So I’m going to go through it all step-by-step, and explain exactly how you can make nudenotes out of infographics.
Are you ready?
Let’s dive straight in…

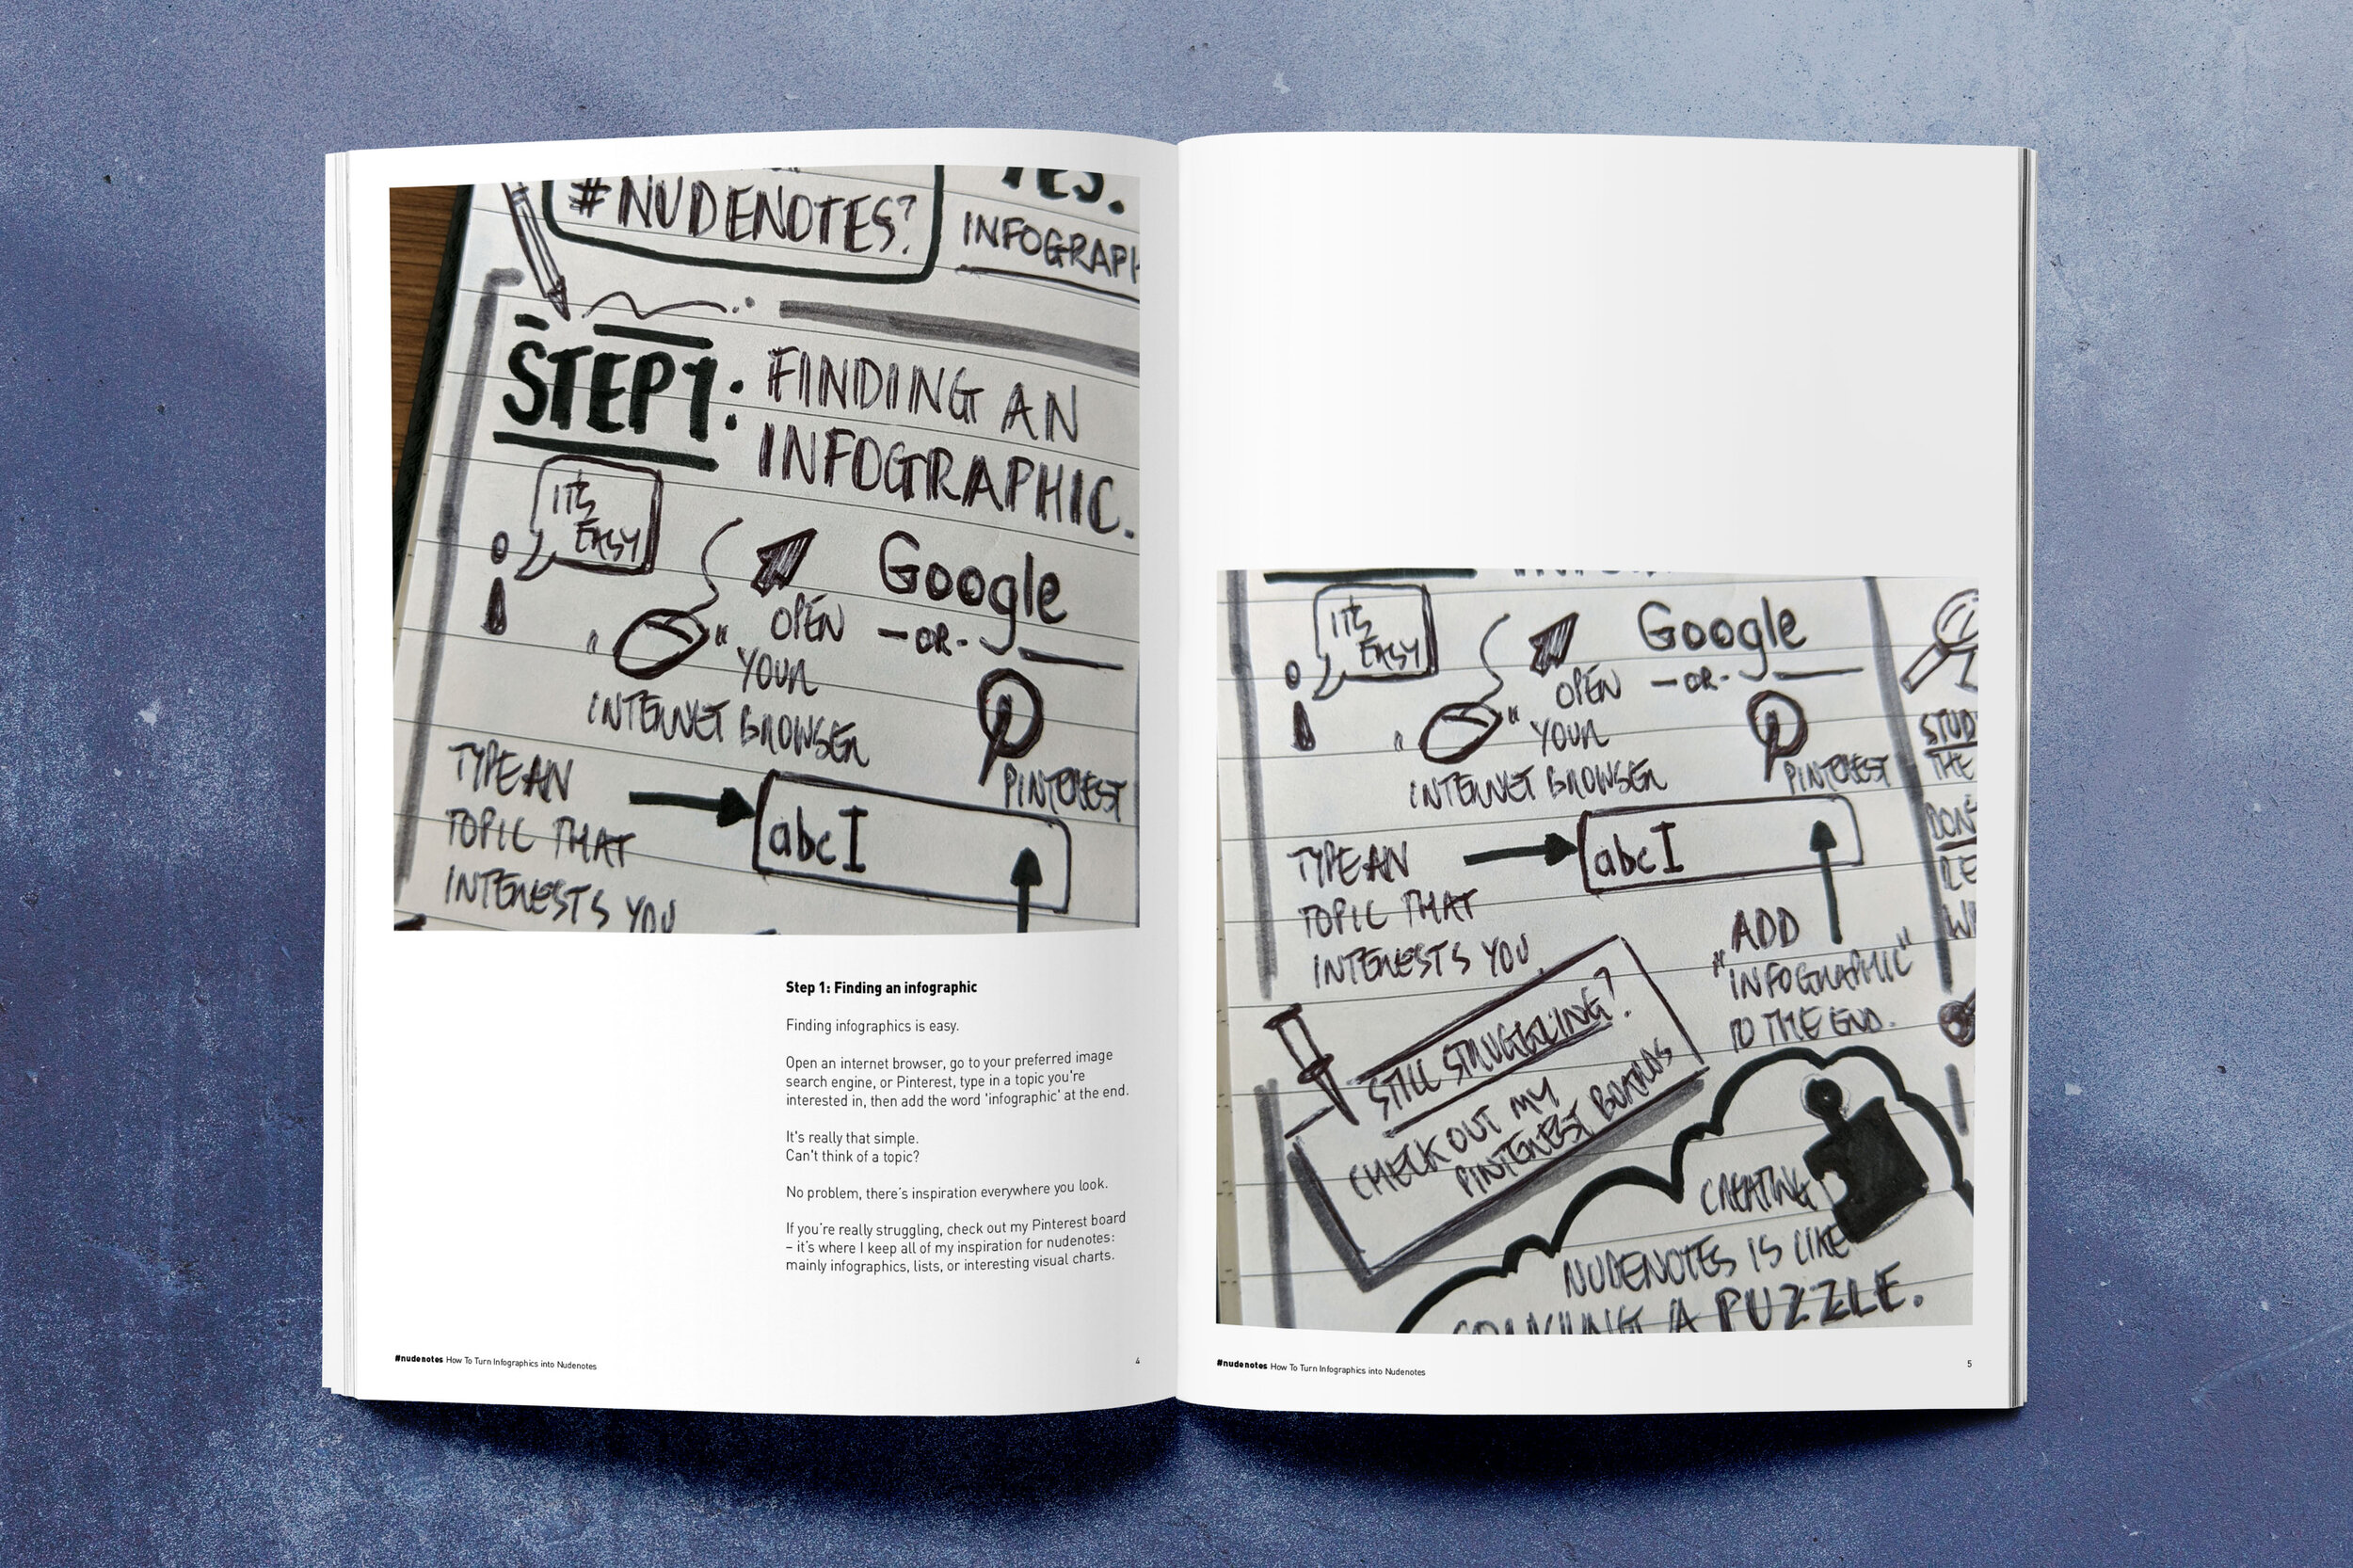
Step 1: Finding an infographic
Finding infographics is easy.
Open an internet browser, go to your preferred image search engine, or Pinterest, type in a topic you're interested in, then add the word 'infographic' at the end.
It's really that simple.
Can't think of a topic?
No problem, there’s inspiration everywhere you look.
If you’re really struggling, check out my Pinterest board – it’s where I keep all of my inspiration for nudenotes: mainly infographics, lists, or interesting visual charts.

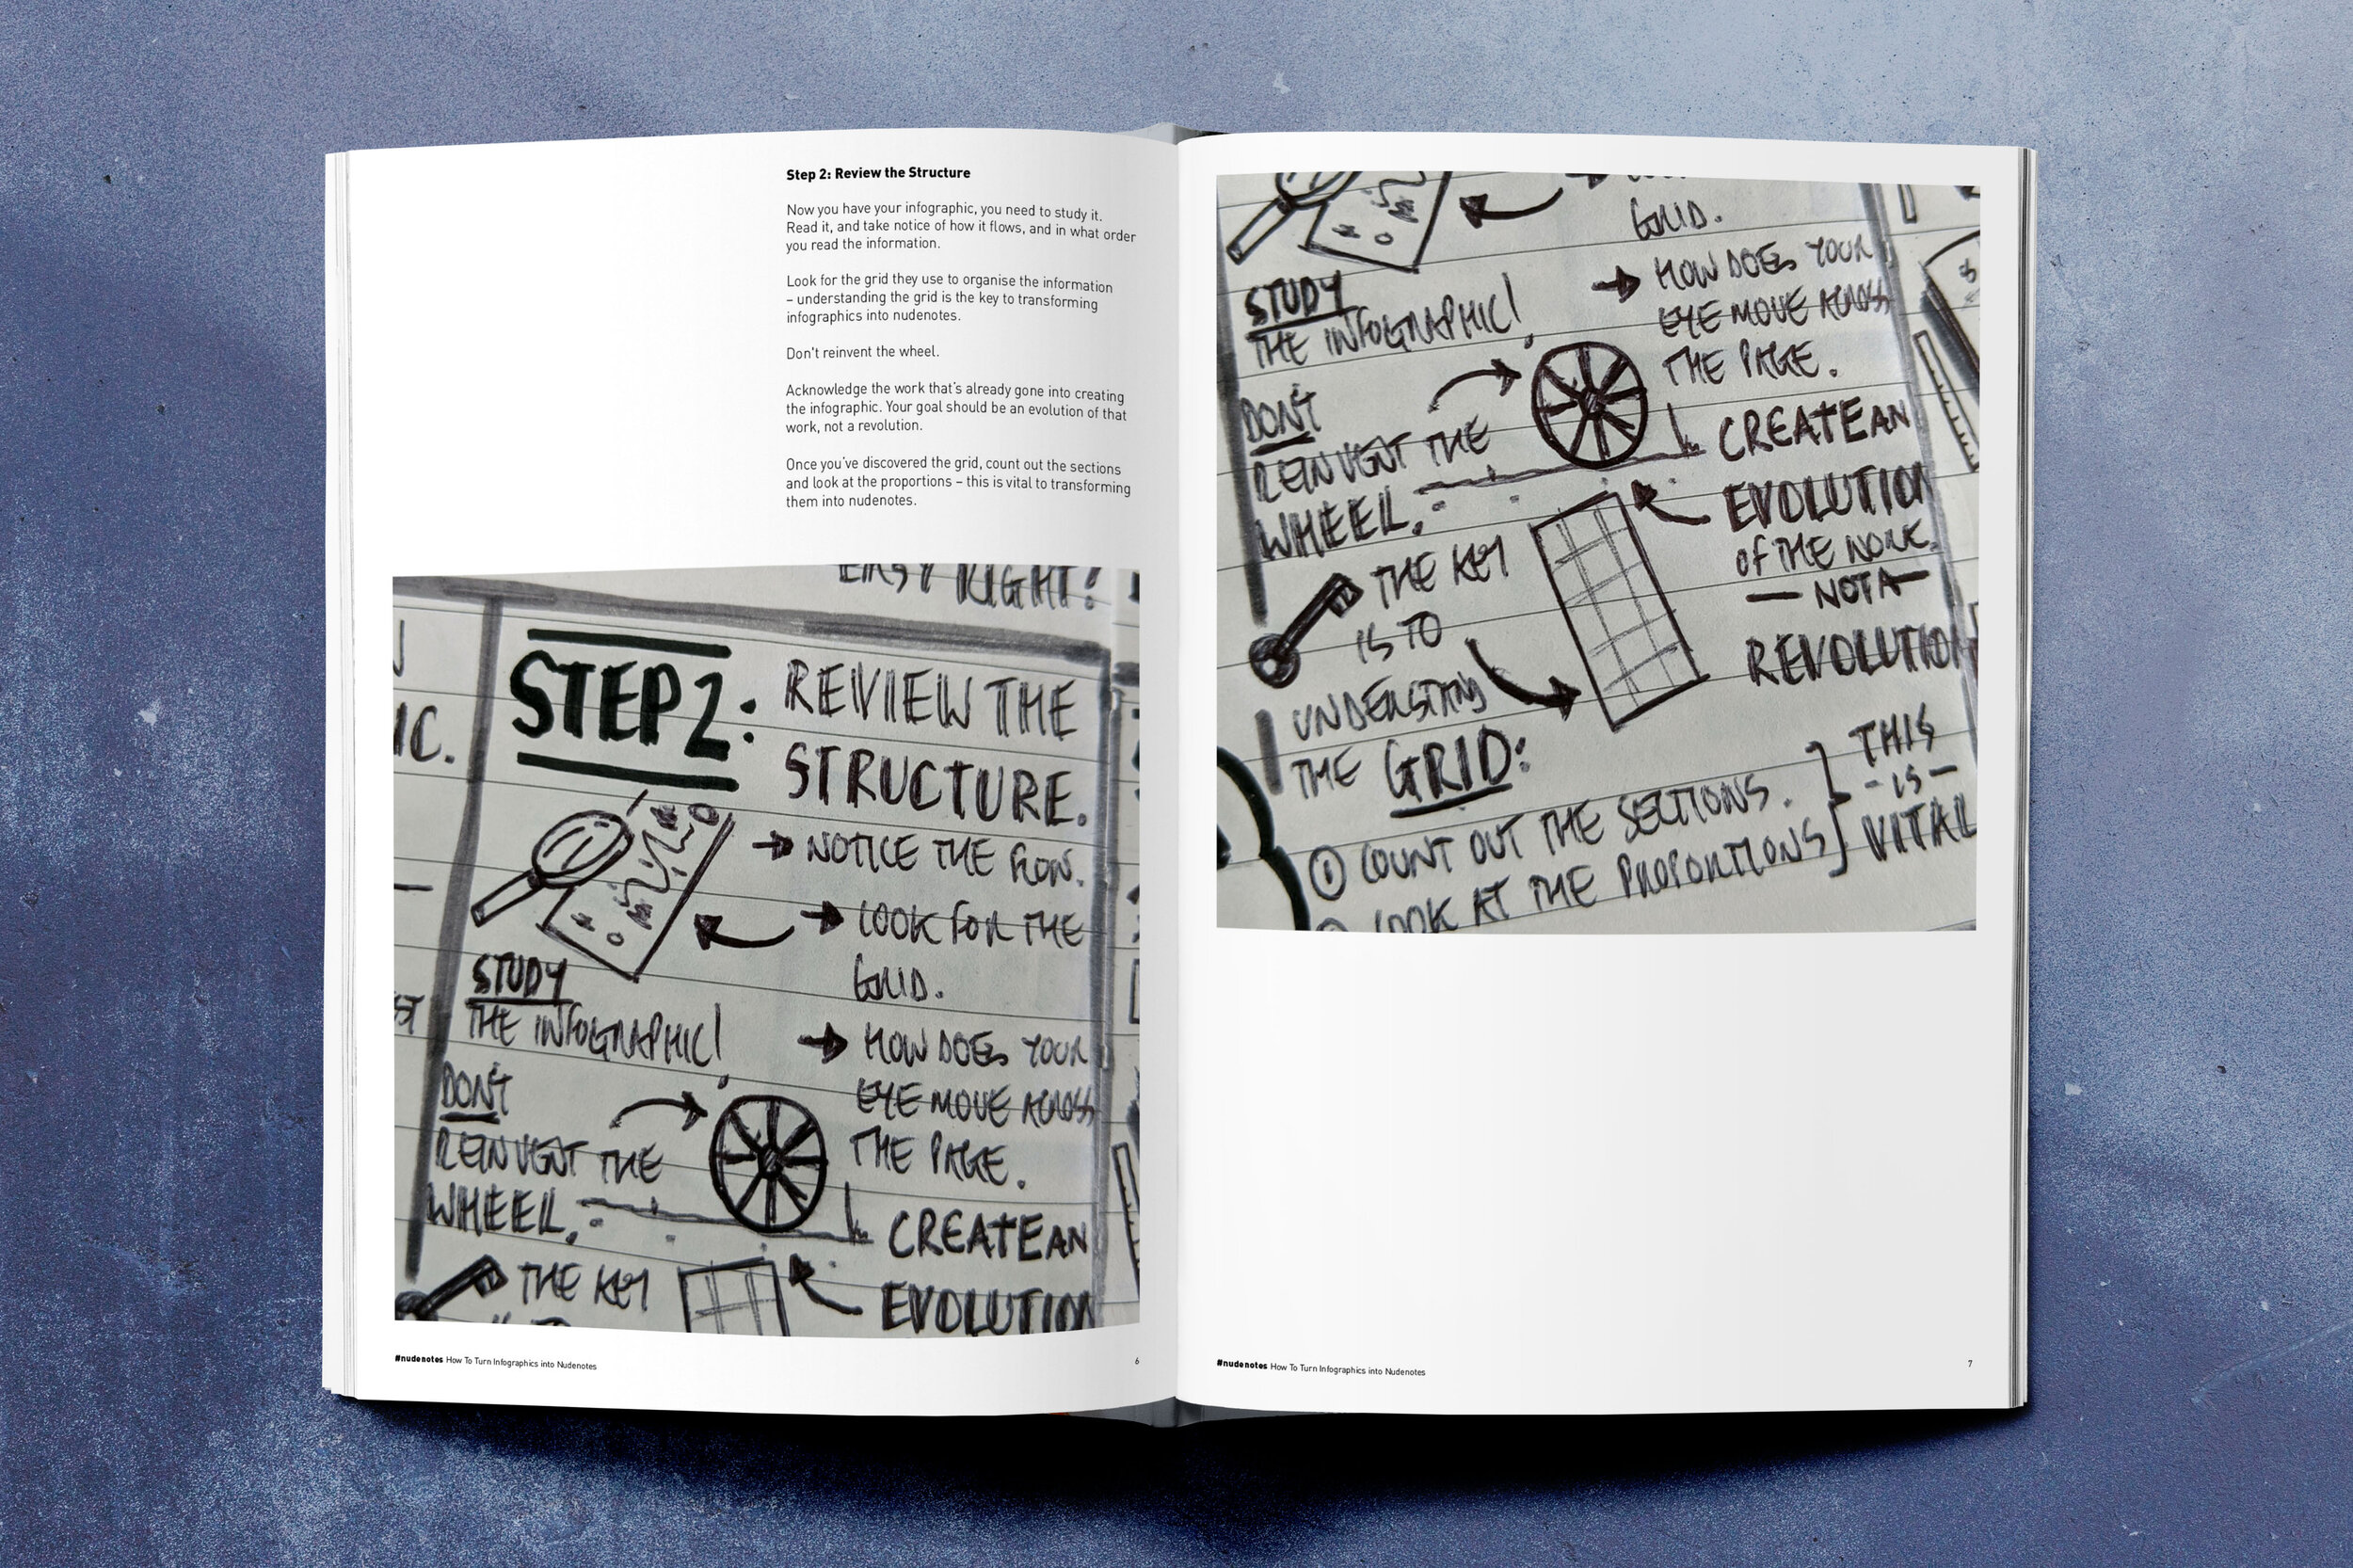
Step 2: Review the structure
Now you have your infographic, you need to study it.
Read it, and take notice of how it flows, and in what order you read the information.
Look for the grid they use to organise the information – understanding the grid is the key to transforming infographics into nudenotes.
Don't reinvent the wheel.
Acknowledge the work that’s already gone into creating the infographic.
Your goal should be an evolution of that work, not a revolution.
Once you’ve discovered the grid, count out the sections and look at the proportions – this is vital to transforming them into nudenotes.

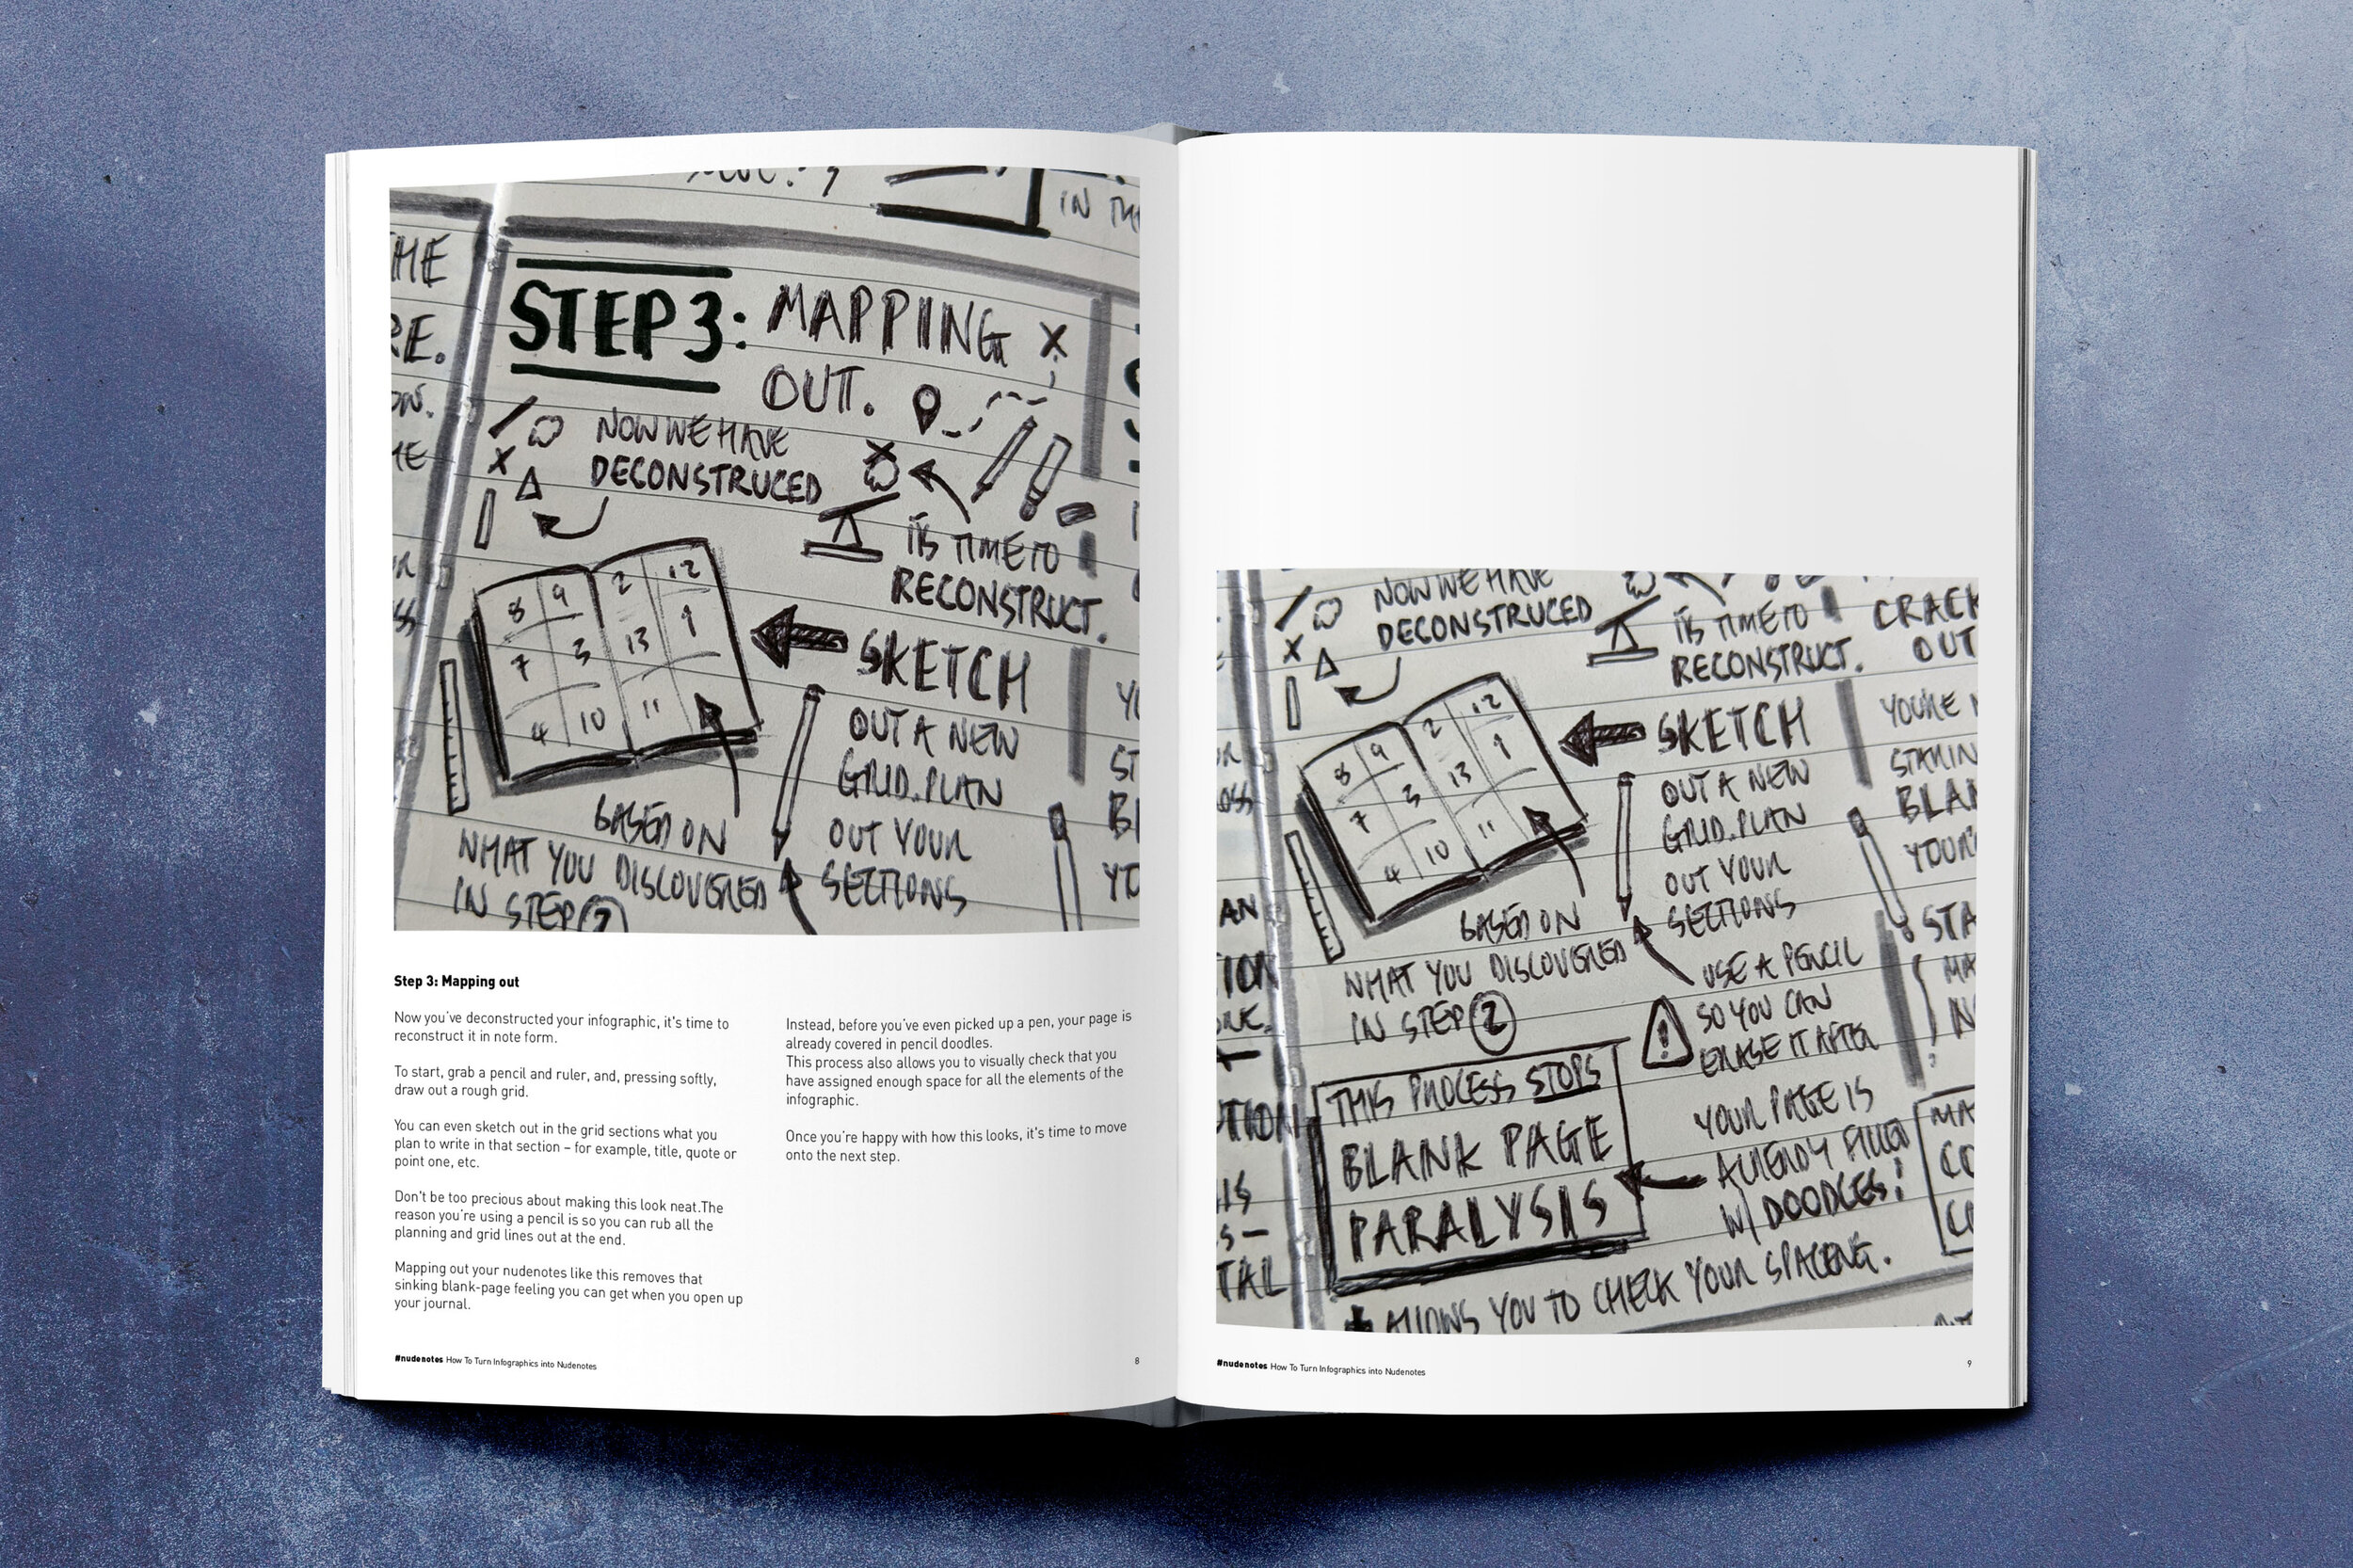
Step 3: Mapping out
Now you’ve deconstructed your infographic, it's time to reconstruct it in note form.
To start, grab a pencil and ruler, and, pressing softly, draw out a rough grid.
You can even sketch out in the grid sections what you plan to write in that section – for example, title, quote or point one, etc.
Don't be too precious about making this look neat.
The reason you’re using a pencil is so you can rub all the planning and grid lines out at the end.
Mapping out your nudenotes like this removes that sinking blank-page feeling you can get when you open up your journal.
Instead, before you’ve even picked up a pen, your page is already covered in pencil doodles.
This process also allows you to visually check that you have assigned enough space for all the elements of the infographic.
Once you’re happy with how this looks, it's time to move onto the next step.

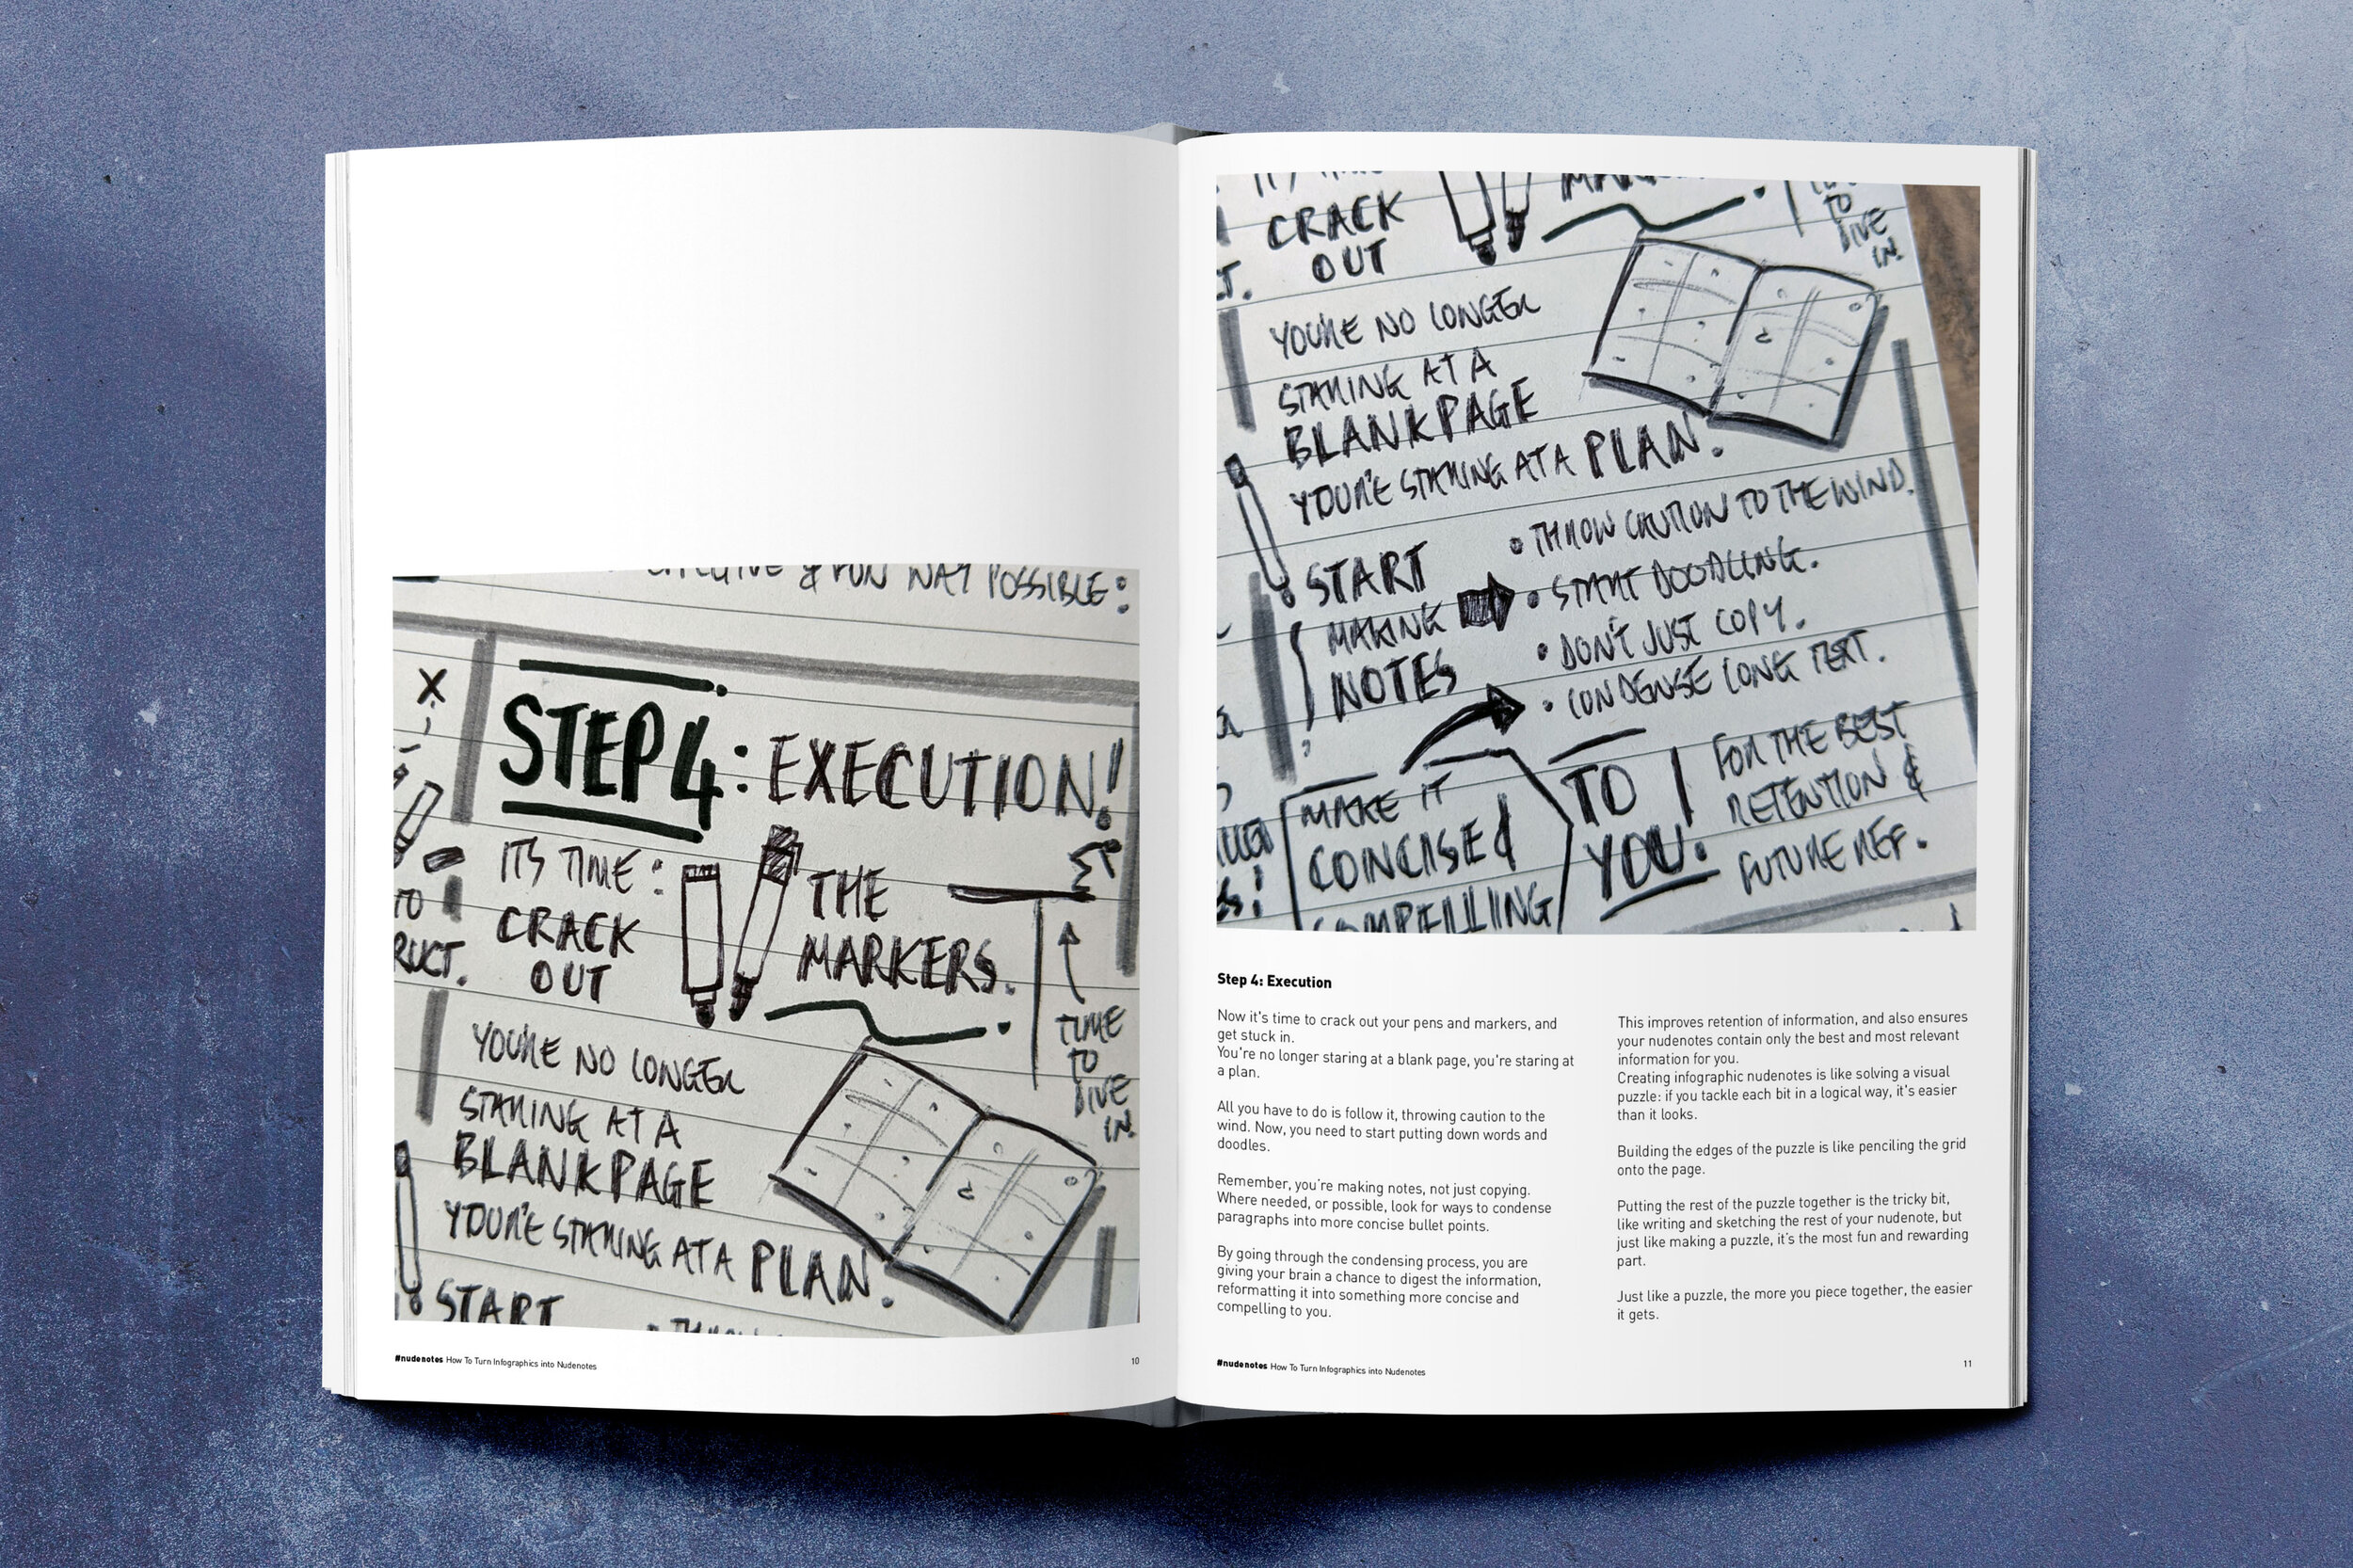
Step 4: Execution
Now it's time to crack out your pens and markers, and get stuck in.
You're no longer staring at a blank page, you're staring at a plan.
All you have to do is follow it, throwing caution to the wind.
Now, you need to start putting down words and doodles.
Remember, you’re making notes, not just copying.
Where needed, or possible, look for ways to condense paragraphs into more concise bullet points.
By going through the condensing process, you are giving your brain a chance to digest the information, reformatting it into something more concise and compelling to you.
This improves retention of information, and also ensures your nudenotes contain only the best and most relevant information for you.
Creating infographic nudenotes is like solving a visual puzzle: if you tackle each bit in a logical way, it's easier than it looks.
Building the edges of the puzzle is like penciling the grid onto the page.
Putting the rest of the puzzle together is the tricky bit, like writing and sketching the rest of your nudenote, but just like making a puzzle, it’s the most fun and rewarding part.
Just like a puzzle, the more you piece together, the easier it gets.
Now that you have the basic steps, here are some top tips to overcome some of the most common sticking points:

Image courtesy of @kellysikkema via Unsplash.
Gaps in your grid
Sometimes no matter how well you plan out your grid, there are some annoying empty spaces not yet filled with any nudenotes.
White space can be used to great effect to give your nudenotes space to breathe, increasing the legibility of your notes.
However, due to the raw and unedited nature of making nudenotes, spaces in your nudenotes can look like a missing tooth in an otherwise perfect smile.
To overcome this, you need to get creative.
For smaller gaps, fill them with extra doodles and drawings that relate to the content of your nudenotes.
If you’re struggling to think of ideas, head over to Iconfinder - this website contains thousands of illustrations and icons which you can browse through.
For larger gaps, you can fill them in with quotes or statistics to enrich your nudenotes.
The internet is full of websites and resources to find these - often I just open up Google images, type in the topic I’m nudenoting, and just add the word ‘quote’ to the end.

Image courtesy of @kellysikkema via Unsplash.
Running out of space
Just as common as gaps in your grid, we have the reverse – running out of space.
Once you’ve put pen to paper, it’s difficult to undo.
But hey, Hakuna Matata – no worries.
You’re creating nudenotes.
The reason they’re called nudenotes is because they are raw and full of imperfections.
It’s all part of the charm, those are the best bit – they add all the personality and energy, and make your nudenotes unique to you.
I have created hundreds of nudenotes, and I still make some of the same mistakes I made doing the first nudenotes.
Running out of space is one that I can’t seem to shake off.
Often, I just make my handwriting smaller towards the end of a sentence, or take a step back and try to shorten the sentence to fit the space.
None of these solutions are the best-looking, but it really doesn’t matter.
The point is that you’re communicating the information you need to – at the end of the day, that’s all that matters!

Image courtesy of @kellysikkema via Unsplash.
This infographic is too complex
This happens to me a lot, I find an infographic I love – it’s layered with tonnes of inspirational content.
There’s just one problem…
It's too massive and complex.
It takes you an hour to read the whole thing, and by the end, your finger hurts from scrolling.
Never fear, I have two solutions for this:
One: figure out how to break the infographic down into parts, which you can divide across multiple pages in your journal.
Two: save it for later – as I mentioned before, I have a Pinterest board where I curate my inspiration for nudenotes.
There are many giant infographics on there that I haven’t yet tackled, and some of them have been on there for months.
Transforming one of these giant infographics takes a lot more time planning and processing to achieve a good result.
There’s no shame in saving these challenges for when you have the time and energy to slay that particular giant.

That’s it: how to turn infographics into nudenotes!
If you still want more information on creating nudenotes check out these other blog articles.
Until 29/03/2020 (next Sunday) you can grab a FREE copy of this blog and images of all my supporting nudenotes from NSC’s shop.
After this it will still be available, but for the small price of £1.99!
All the money from NSC’s products go towards developing new content and ideas for this platform. Here is a look at what you get for your money:
Stay tuned for more hints and tips on the nudenotes process!
Hopefully this article has inspired you to pick up a pen and join the nudenotes revolution.
Don’t forget to share your notes with me on Instagram using the hashtag #nudenotes – I can't wait to see what you've got!


Dull packaging copy, uninspiring design, and, worst of all “I just don’t like it”.